Diagnose CPU and memory issues in Node.js apps on Azure App Service for Linux
When a Node.js application starts slowing down, consuming more memory over time, or using more CPU than expected, the difficult part is often figuring out what the application is actually doing when the problem occurs.
You can now collect and analyze memory dumps and CPU profiles for Node.js applications running on Azure App Service for Linux.
The experience is available in Kudu for App Service on Linux and supports both collection and built-in analysis, so you can investigate CPU and memory issues without having to download the dump or profile and analyze it separately.
Memory profiling: understand what is using your heap
A memory dump gives you a point-in-time snapshot of the Node.js process memory.
Select the App Service instance and Node.js process you want to investigate, then choose Collect & analyze to capture the dump and generate an analysis report.
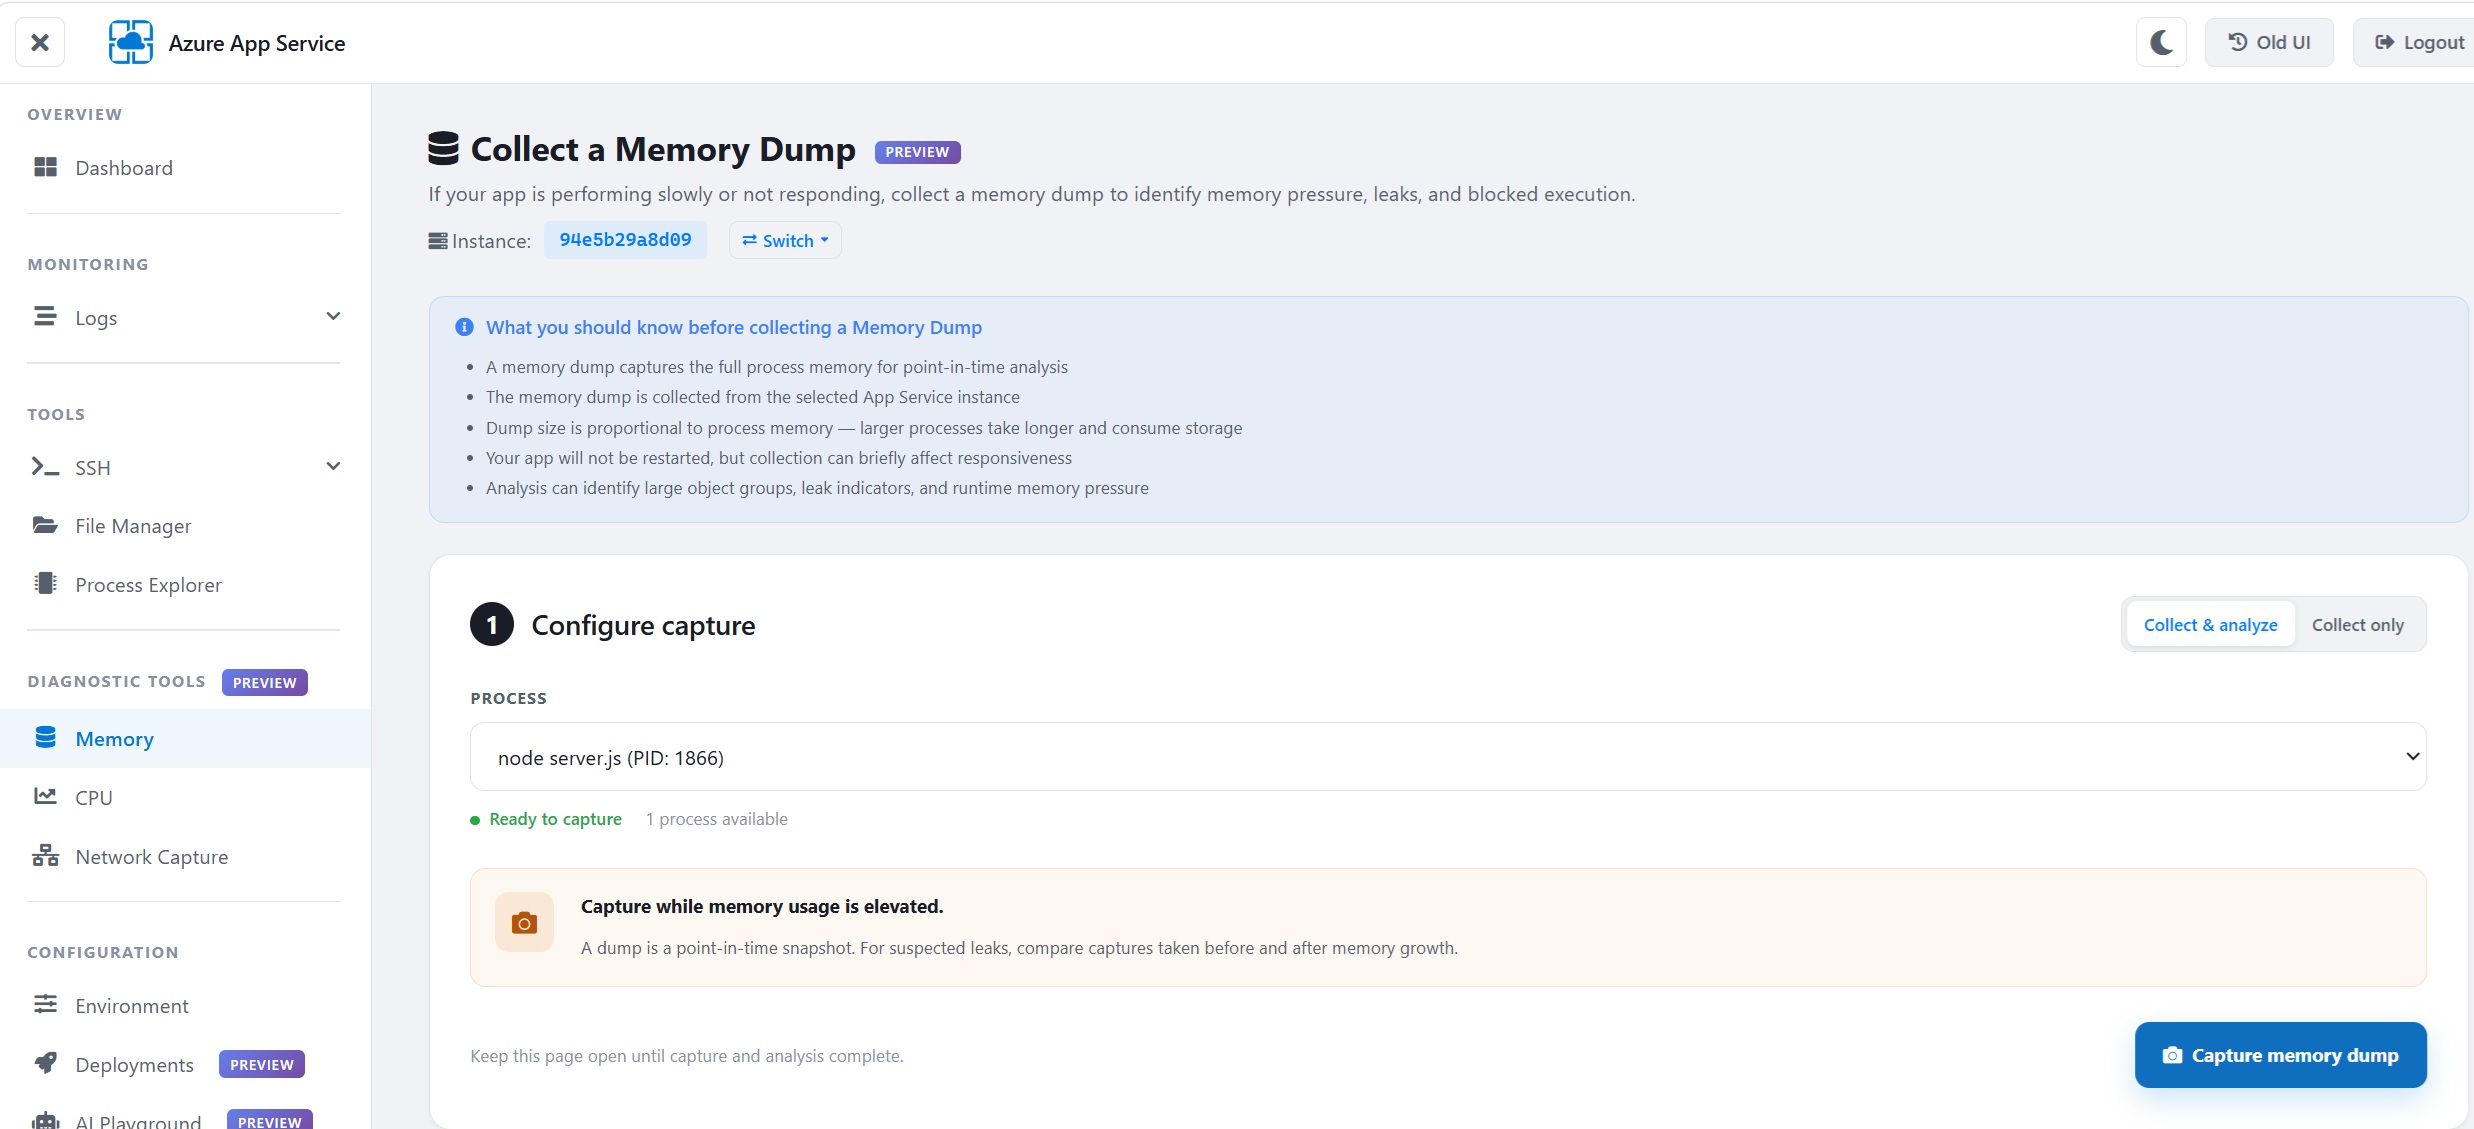
A few things to keep in mind:
- The memory dump is collected from the selected App Service instance.
- A memory dump captures the full process memory for point-in-time analysis.
- Dump size is proportional to process memory. Larger processes take longer to capture and consume more storage.
- Your app is not restarted, but collection can briefly affect responsiveness.
- A memory dump represents a specific moment in time rather than memory behavior over a period.
If you are investigating a suspected memory leak, it is best to capture the dump while memory usage is elevated. Comparing captures taken before and after memory growth can also help identify objects that are accumulating.
Built-in memory analysis
Once the capture is complete, App Service can analyze the dump and generate a report with a high-level view of the heap and the areas that may need further investigation.
The report includes information such as:
- total heap usage and object count
- memory used by application objects versus the V8 engine
- heap composition by object type
- large strings and other unusually large objects
- high closure counts
- object types with unusually high instance counts
- potential memory leak patterns
- application objects consuming the most memory
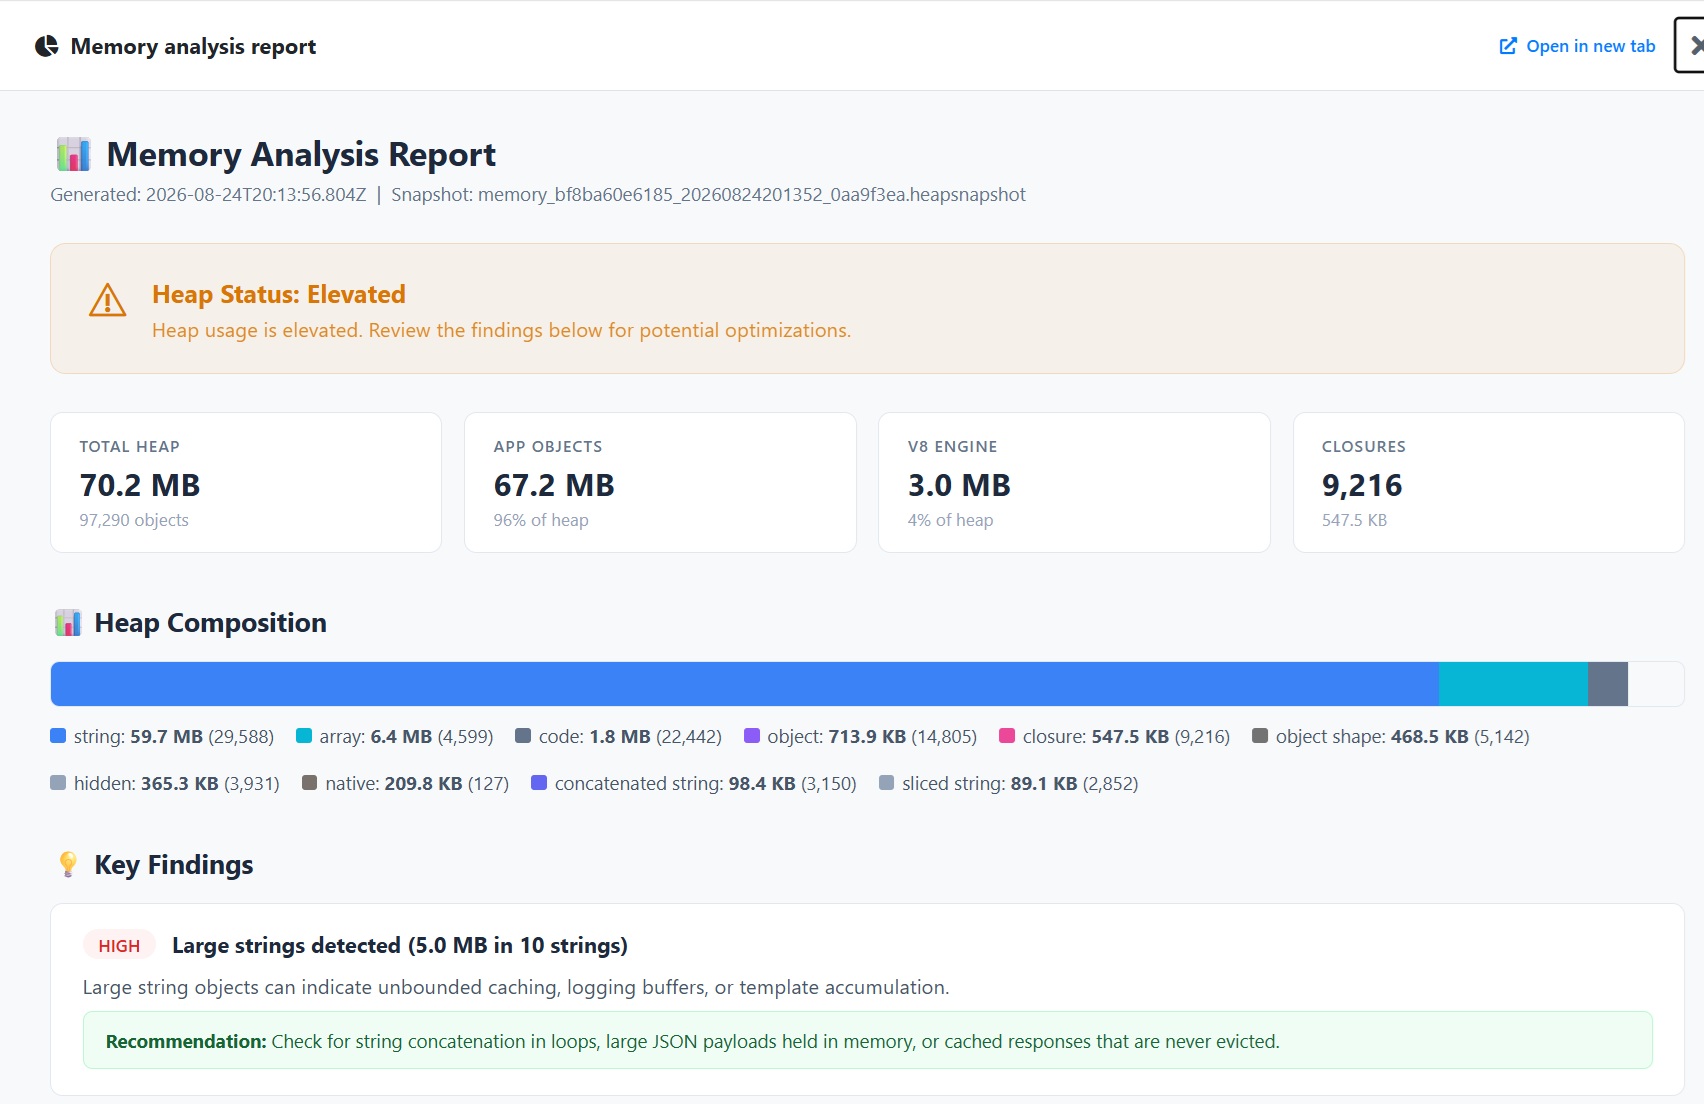
The report also surfaces key findings and recommendations to help narrow down the problem.
For example, unusually large strings may point to large JSON payloads, logging buffers, cached responses, or string accumulation. A high number of closures may indicate event listeners or callbacks that are not being cleaned up.
The analysis can also identify object types with unusually high instance counts, which may help highlight potential unbounded growth.
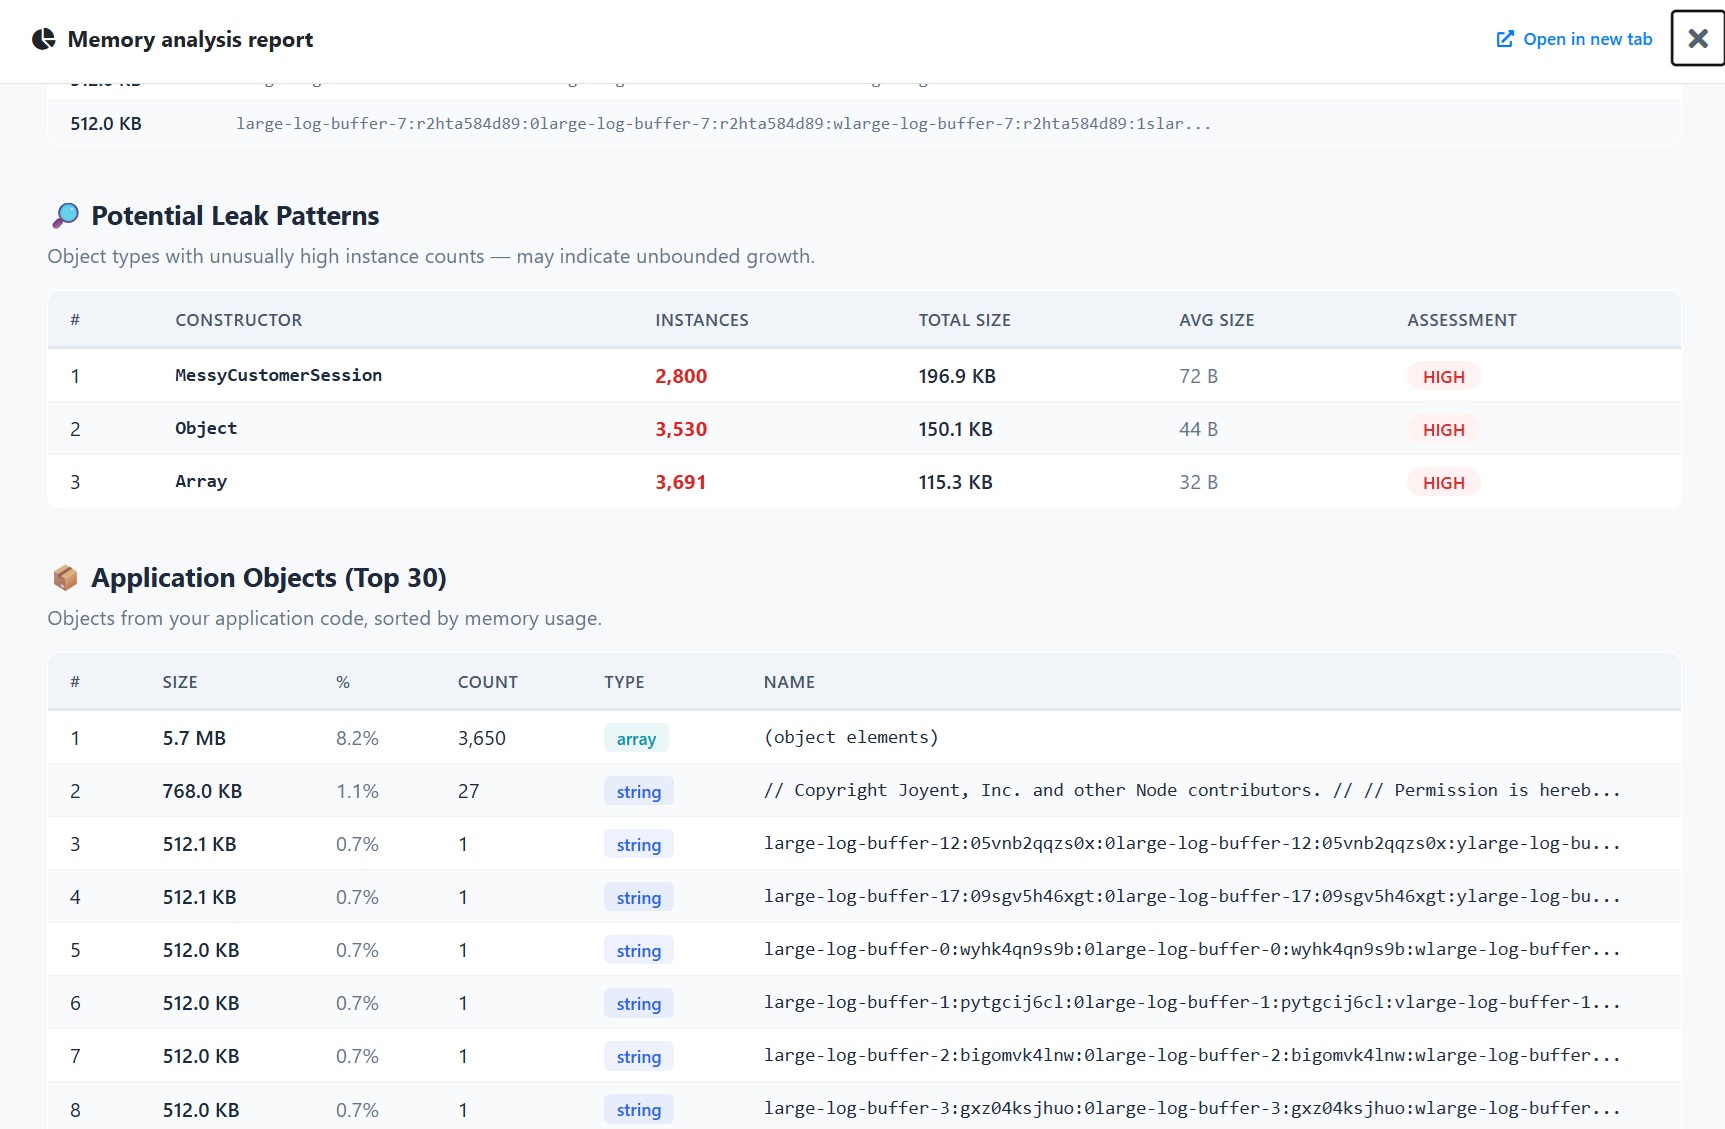
Instead of starting with thousands of objects in a raw heap dump, you can start with the areas that are most likely to need attention.
CPU profiling: find the code consuming CPU
CPU profiling works differently because CPU behavior needs to be observed over a period of time.
The profiler samples the application’s call stack at regular intervals to identify hot paths and determine where the application is spending its CPU time.
Select the Node.js process and profile duration, then start profiling. You can choose a predefined duration such as 15, 30, or 60 seconds, or specify a custom duration.
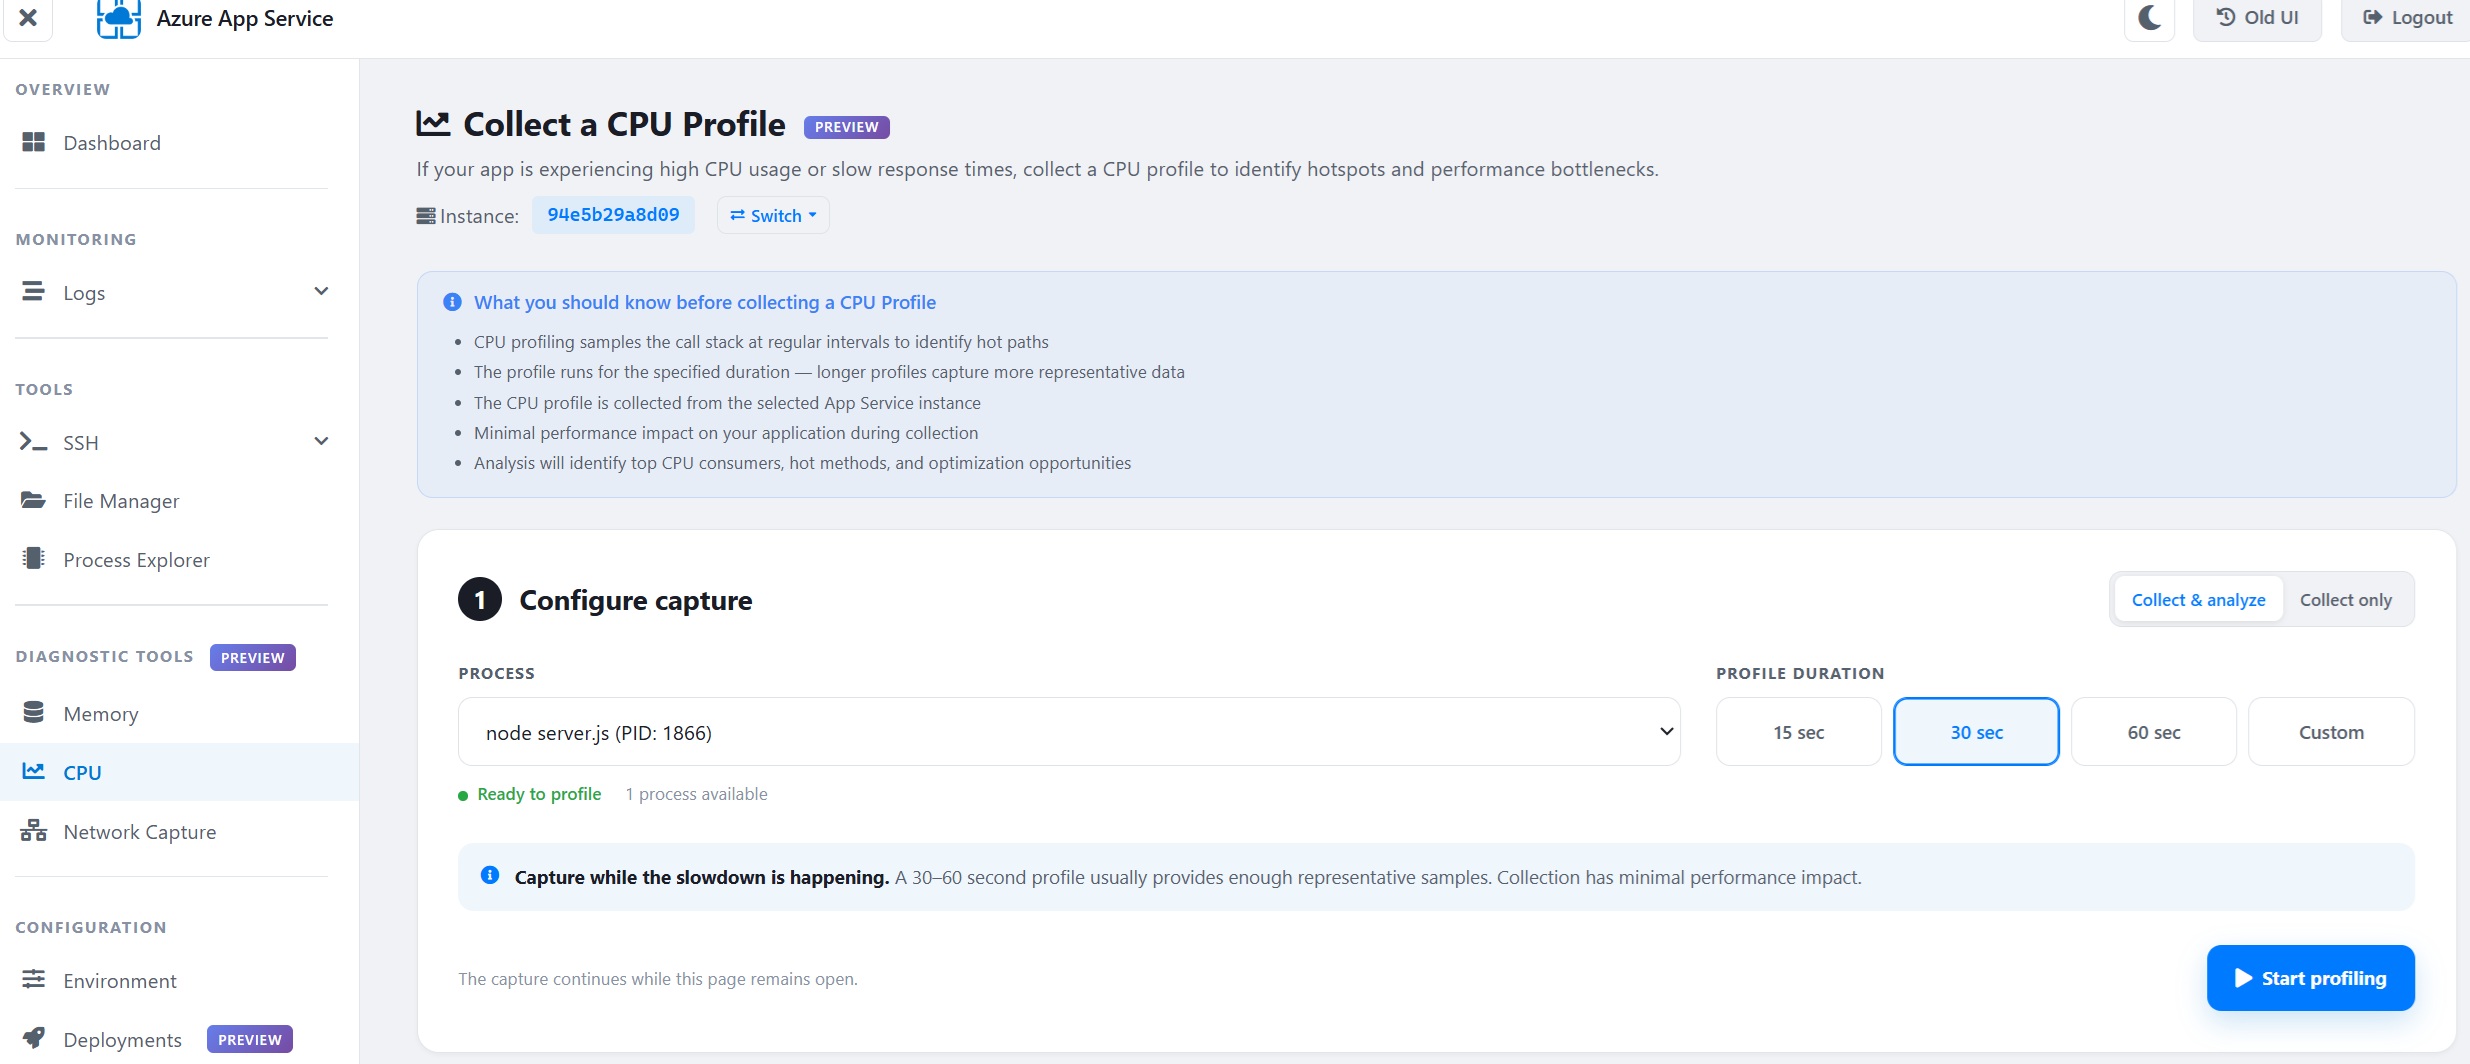
A few things to keep in mind:
- The CPU profile is collected from the selected App Service instance.
- CPU profiling samples the call stack at regular intervals to identify hot paths.
- The profile runs for the specified duration.
- Longer profiles generally capture more representative data.
- Profiling has minimal performance impact on the application.
For best results, capture the profile while the slowdown or high CPU usage is actually occurring.
From CPU usage to the function responsible
After profiling completes, the analysis report shows where CPU time was spent during the profiling period.
For Node.js applications, the report can surface:
- active CPU during the profile
- CPU time spent in application code
- Node.js runtime overhead
- garbage collection overhead
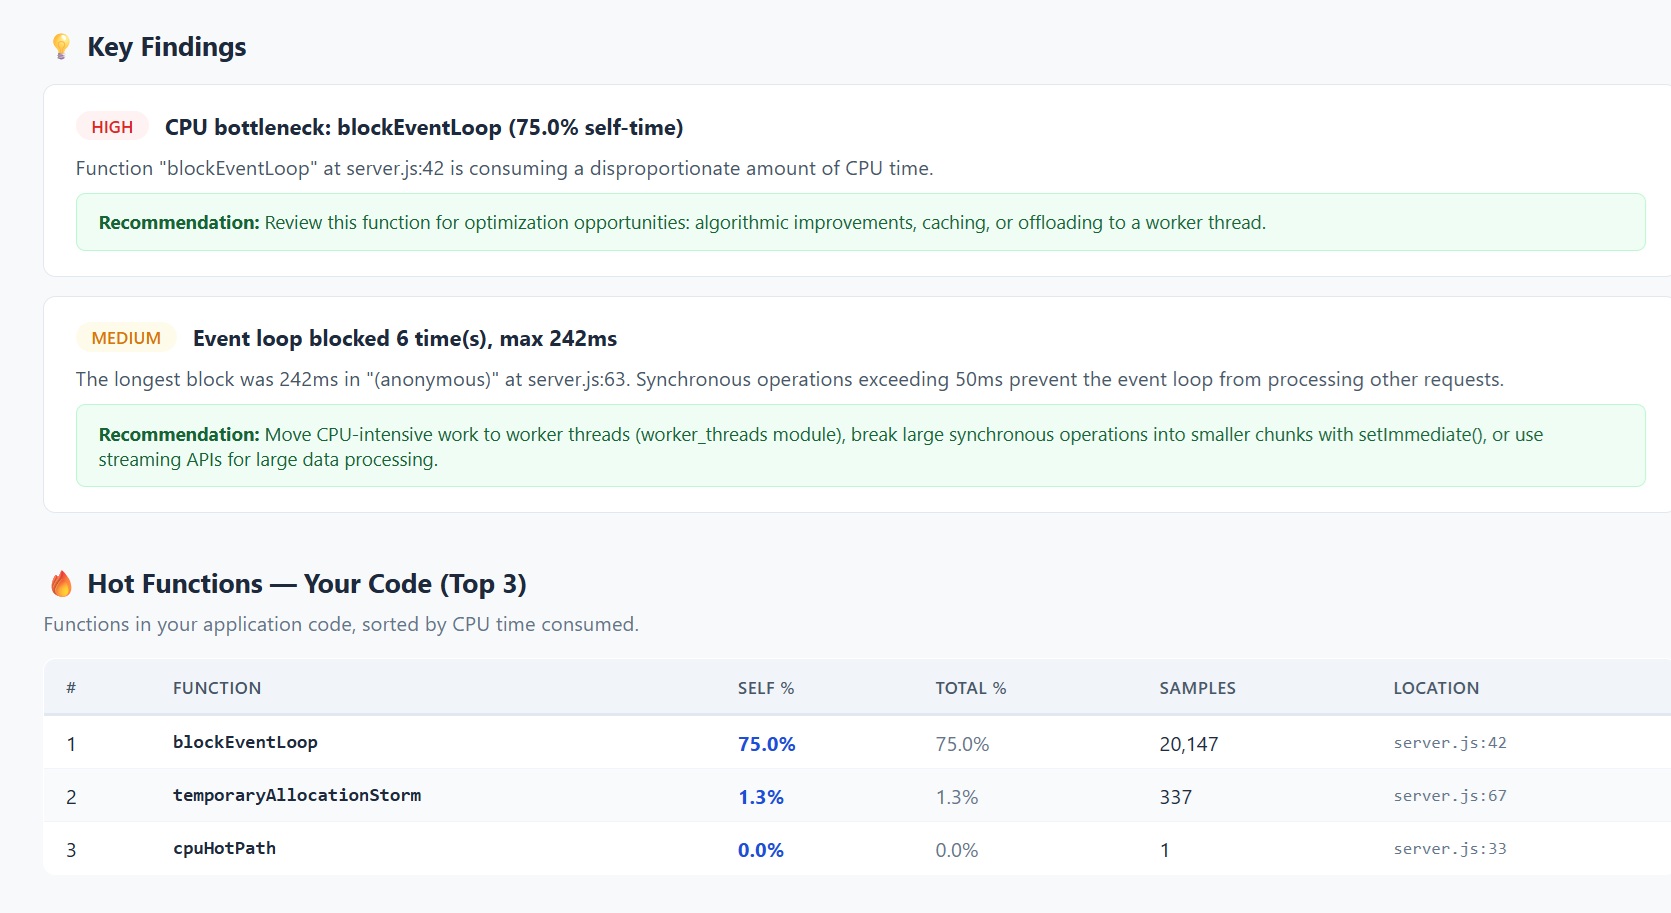
- hot functions consuming the most CPU
- source locations for identified functions
- event loop health
- long-running synchronous operations
- potential event loop blocking
- recommendations based on the findings
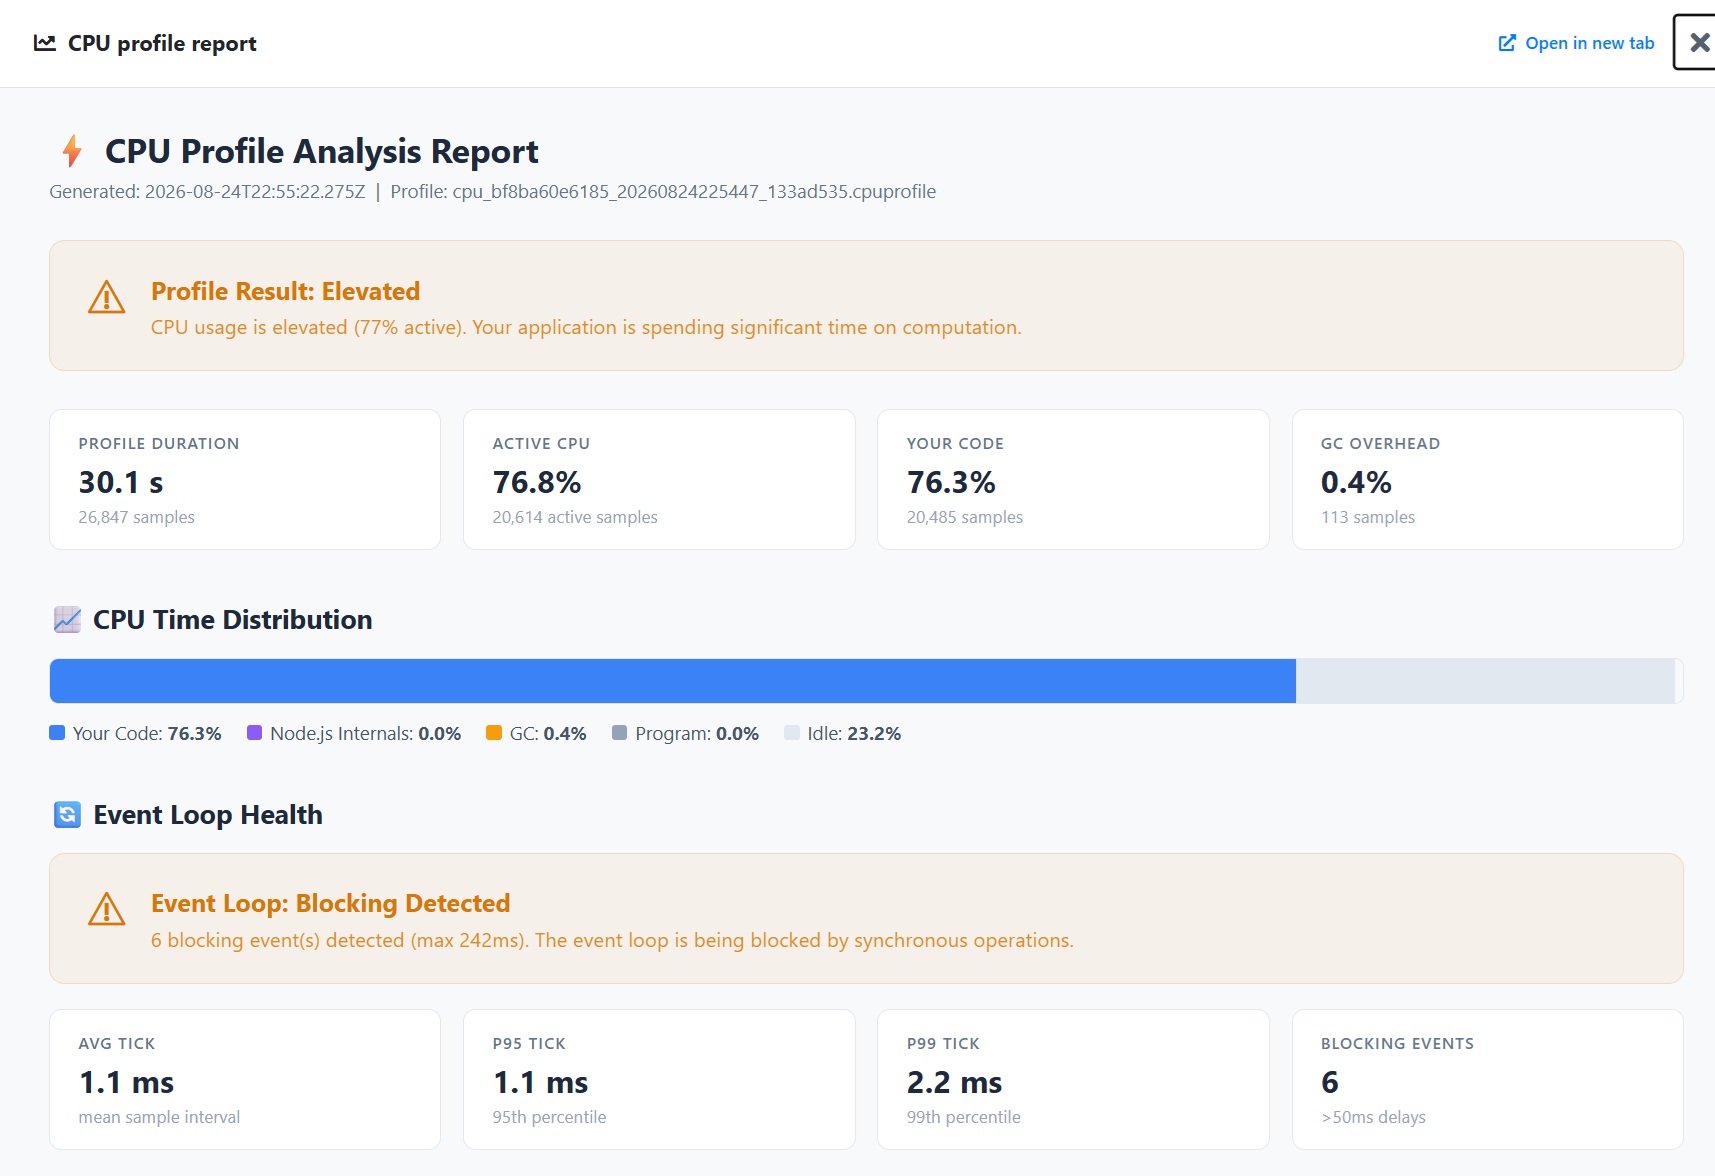
This can help move the investigation from a general symptom such as high CPU to the specific function or execution path responsible.
For example, if one application function accounts for most of the sampled CPU time, the report can identify the function and its source location so you can investigate it directly.
The profiler can also highlight Node.js-specific issues such as event loop blocking. Long-running synchronous operations can prevent the event loop from processing other requests, resulting in slow response times even when the underlying cause is not obvious from CPU metrics alone.
Collect and analyze - or just collect
Both CPU and memory profiling support two modes.
Collect & analyze captures the memory dump or CPU profile and generates an App Service analysis report.
Collect only captures the diagnostic artifact without running the built-in analysis, allowing you to download it and use your preferred profiling or debugging tools if needed.
This gives you a quick way to investigate common issues while still keeping access to the underlying diagnostic data for deeper analysis.
Getting started
To try CPU or memory profiling:
- Open Kudu for your App Service Linux app.
- Under Diagnostic Tools, select Memory or CPU.
- Select the App Service instance you want to investigate.
- Select the Node.js process.
- For memory, capture the dump while memory usage is elevated.
- For CPU, select a profiling duration and capture while the CPU issue or slowdown is occurring.
- Select Collect & analyze to generate the built-in analysis report.
CPU and memory problems can have many causes, but the first step is usually getting visibility into what the application was doing when the problem occurred.
With CPU and memory profiling for Node.js applications in Kudu, App Service for Linux can now help you move from a high-level performance symptom to the code, objects, or runtime behavior that may be causing it.
